
Market Alert 2.13.25
As of mid-day today, our model has detected a notable shift in the probability of positive returns over the 14-day horizon. The model now indicates an 85.7% likelihood that the major market indices will be higher 14 days from now, signaling a strong bullish outlook.
However, it is important to note that the 7-day horizon currently reflects only a "slightly above average" probability of positive returns. Given this, we remain cautious about increasing risk exposure at this time, as historical patterns suggest that similar conditions have been accompanied by short bursts of volatility. We will continue monitoring market developments and provide updates as needed.
Disclaimer: The information provided here is for educational and informational purposes only and should not be interpreted as financial advice. I am not a licensed financial advisor, and my portfolio strategies may not align with your financial goals or risk tolerance. All investments carry inherent risks, including the potential loss of principal. Historical data and model-based projections are not guarantees of future performance. Please consult with a licensed financial professional before making any investment decisions.

Market update 2.8.25
Looking ahead to the coming trading days, our model indicates a decreased probability of positive returns over the 7-day and 14-day horizons for the Dow, S&P 500, and Nasdaq. Several notable economic events are scheduled for next week, with particular attention on Federal Reserve Chair Jerome Powell’s testimony before Congress regarding monetary policy and the economic outlook, scheduled for Wednesday. This event could provide key insights into future market movements and policy direction.
Additionally, our model suggests that the market remains vulnerable to a sharp downward move, and Powell’s testimony could serve as a potential catalyst for such volatility. As always, we remain attentive to evolving market conditions and potential shifts in sentiment.
Disclaimer: The information provided here is for educational and informational purposes only and should not be interpreted as financial advice. I am not a licensed financial advisor, and my portfolio strategies may not align with your financial goals or risk tolerance. All investments carry inherent risks, including the potential loss of principal. Historical data and model-based projections are not guarantees of future performance. Please consult with a licensed financial professional before making any investment decisions.

The Game Theory of Tariffs: What’s Next for Markets in 2025?
Introduction
The United States has once again entered a period of heightened trade tensions, implementing new tariffs on Canada, Mexico, and China as of February 2025. These tariffs—25% on Canadian and Mexican imports and 10% on Chinese goods—are intended to address concerns over trade imbalances, immigration, and national security. However, history tells us that tariff battles often lead to economic instability, market volatility, and retaliatory measures from affected countries.
Using game theory, we can predict how key players—these trading partners and the U.S.—will likely respond, and what that means for businesses, investors, and markets in the months ahead.
Game Theory and the Likely Outcomes
At its core, this tariff standoff resembles a prisoner’s dilemma, where each country must decide whether to retaliate, negotiate, or absorb the costs. Historically, tit-for-tat strategies dominate trade disputes—when one country imposes tariffs, others respond with their own. However, escalating trade wars harm all players, making cooperative negotiation the rational long-term move.
We can analyze the possible payoffs for each country using a simplified scoring system based on economic and political outcomes:

Game Theory Matrix
Optimal Strategies Based on Payoff Outcomes:
Short-Term (0-6 months): Tit-for-Tat Retaliation Likely
Canada and Mexico implement countermeasures on U.S. exports (-2 U.S., -2 Can/Mex).
China retaliates selectively while also using WTO legal pressure (-3 U.S., -3 China).
The U.S. maintains tariffs but does not escalate immediately.
Medium-Term (6-12 months): Two Likely Paths
Trade War Escalates (-3 to -5 U.S. loss) if the U.S. raises tariffs further.
Negotiations Begin (+2 U.S.) if selective tariff exemptions are introduced.
Long-Term (12+ months): New Trade Agreement or Selective Tariff Rollbacks
U.S. rolls back some tariffs in exchange for minor trade concessions (+2 U.S., -1 China).
Markets stabilize as trade uncertainty fades.
What History Tells Us About Tariff-Induced Market Shocks
If history is any guide, market volatility is almost guaranteed. During the 2018-2019 U.S.-China trade war, tariffs wiped out an estimated $1.7 trillion in U.S. equity value, according to National Bureau of Economic Research (NBER). The S&P 500 saw multiple sharp drops following major tariff announcements, with trade-sensitive sectors—manufacturing, agriculture, and retail—taking the hardest hits.
Similar dynamics could unfold in 2025. If the U.S. maintains or escalates tariffs, markets will likely react negatively, especially in import-heavy industries like autos, semiconductors, and consumer goods. However, if the administration signals willingness to negotiate or selectively remove tariffs, stocks could stabilize as trade uncertainty diminishes.
Projected Market Scenarios for 2025
Based on historical patterns and current policy directions, three potential market trajectories emerge:
Best-Case Scenario (+10% S&P 500 growth): Partial tariff rollback, inflation stabilizes, and earnings growth remains strong. Markets rally as trade fears subside.
Moderate-Case Scenario (+3% S&P 500 growth): Tariffs remain, but minor exemptions ease supply chain disruptions. Market performance remains modest.
Worst-Case Scenario (-15% S&P 500 decline): Trade war escalates, inflation surges, and Fed policy remains tight. Stocks tumble as economic uncertainty rises.
For businesses, the next 6-12 months are critical. Importers should negotiate supplier contracts, seek alternative sources, and monitor tariff exemption opportunities. Investors should hedge exposure to trade-sensitive sectors while considering companies with strong domestic supply chains.
Conclusion: What’s the Most Likely Outcome?
While the tariff battle of 2025 is still unfolding, one thing is clear: markets hate uncertainty, and trade wars historically lead to short-term losses before negotiations eventually bring stabilization. The most probable scenario based on game theory is that tariffs will remain in place for the next 6-12 months, causing economic and market turbulence, but selective reductions and trade agreements will follow within 12-18 months.
The key takeaway for businesses and investors? Prepare for volatility, explore supply chain alternatives, and watch for diplomatic signals that could indicate a turning point in this economic chess match.
Credits
This article was developed through a collaborative effort between Landon Phillips, MBA, and ChatGPT using the Chat4o engine. This work reflects a shared exploration of economic dynamics in response to global trade policies.
Disclaimer: The information presented here is for educational and informational purposes only and should not be construed as financial advice. I am not a licensed financial advisor, and my portfolio may not align with your financial goals or risk tolerance. All investments carry risks, including the potential loss of principal. Historical data and model-based projections are not guarantees of future performance. Always consult a licensed financial professional before making any investment decisions.
Market Update 1.25.25
It’s been a while since we posted a market update. The end of 2024 brought a market pullback that we view as a normal part of healthy growth. During that period, we observed several minor gains and losses within an overall medium-term bearish trend. At the time, our model projected an 85% chance of positive returns over 14, 21, and 28-day horizons. While the shorter-term projections did not materialize, as of Friday’s close, the market is now aligned with the previously published 28-day target.
This serves as an important reminder that 85% is not 100%. Even though our model performs very well, it is not perfect (and no model is). As such, we must always account for potential inaccuracies when constructing our portfolios.
Looking ahead to the coming trading days, our model suggests that moderate gains are probable for the tracked indices over the next seven days. However, we cannot entirely dismiss the possibility that a short-term peak has already occurred. The probability of positive return remains below our nominal threshold, indicating that market bulls may be fatigued and vulnerable to a short-term bearish reversal.
Disclaimer: The information provided here is for educational and informational purposes only and should not be interpreted as financial advice. I am not a licensed financial advisor, and my portfolio strategies may not align with your financial goals or risk tolerance. All investments carry inherent risks, including the potential loss of principal. Historical data and model-based projections are not guarantees of future performance. Please consult with a licensed financial professional before making any investment decisions.


Weekly Update + Market Alert
In last week’s update, we noted potential downside risks in the market, which materialized for both DIA and SPY. However, QQQ ended the week with a positive week-over-week gain. Our price targets remained well within the acceptable criteria for the quant model, and most notably, the model was exceptionally accurate for SPY, predicting a value of 604.77 compared to an actual result of 604.21.
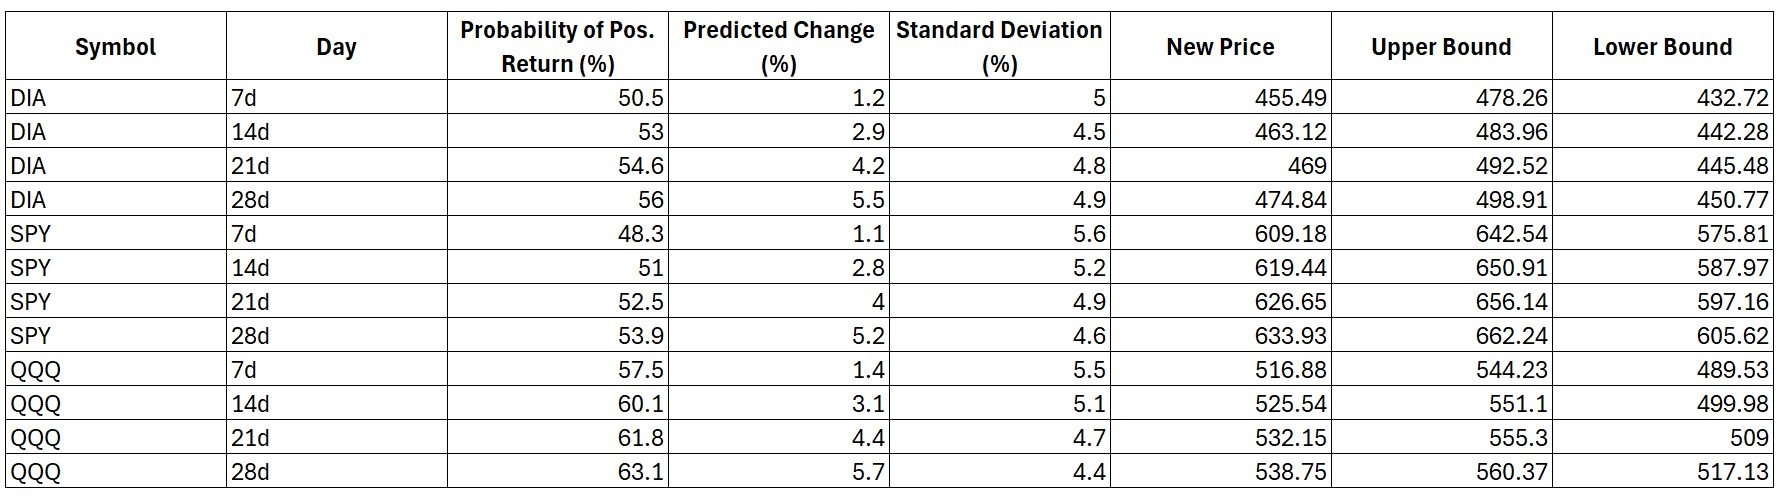
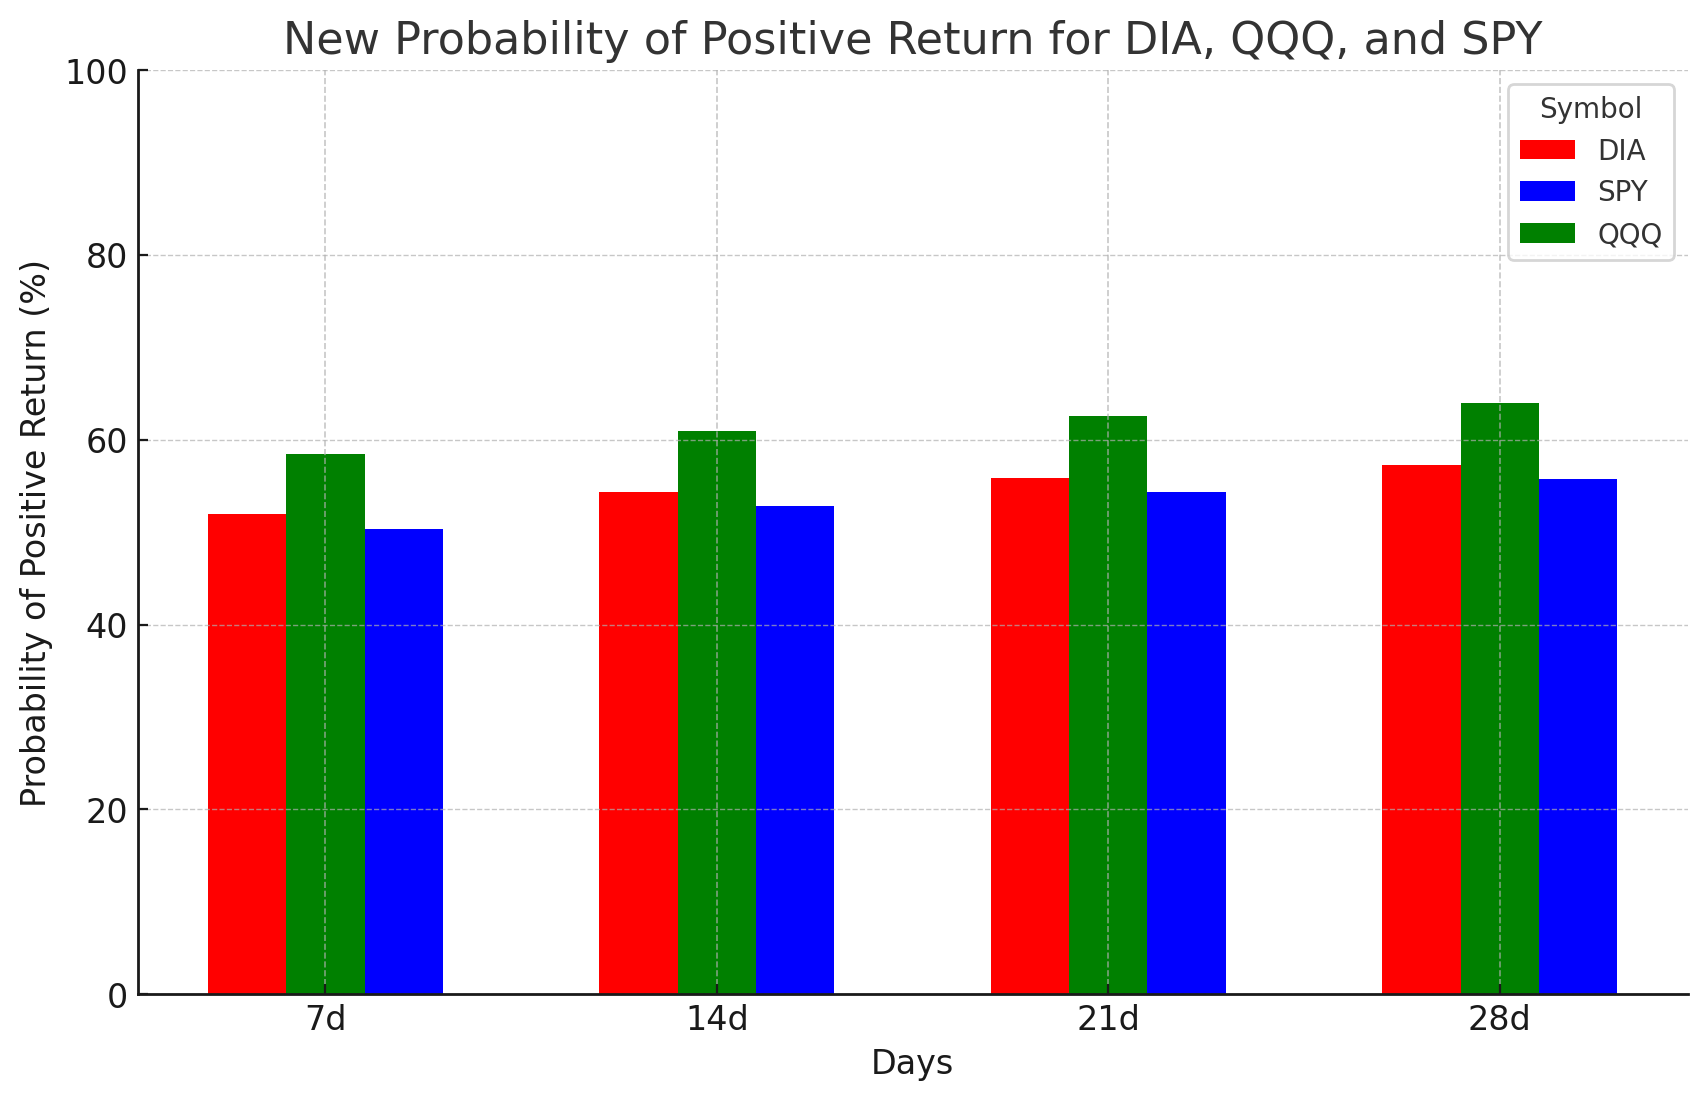
Looking ahead to next week, our quant model indicates an increased likelihood of positive returns. The model shows a 71% probability of positive returns for DIA and SPY over the next 7 days. For QQQ, the probability is 54.1% over 7 days, rising substantially to 85% over a 14-day horizon. Given the recent run-up in QQQ, this projection aligns with broader market dynamics. Based on these probabilities, we are issuing a bullish entry window alert at this time. While some downside risks remain, the historical performance of these indices under similar conditions suggests a short- to medium-term bullish turn is likely in the coming week.
Disclaimer: The information provided here is for educational and informational purposes only and should not be interpreted as financial advice. I am not a licensed financial advisor, and my portfolio strategies may not align with your financial goals or risk tolerance. All investments carry inherent risks, including the potential loss of principal. Historical data and model-based projections are not guarantees of future performance. Please consult with a licensed financial professional before making any investment decisions.


Weekly Update 12.7.24
In last week’s update, we observed signs of early market exhaustion, though there remained potential for moderate gains. Over the course of the trading week, the QQQ and SPY indices moved higher, while the DIA experienced a slight decline. This performance aligns broadly with our model’s expectations, particularly regarding the “probability of positive return” metric. This metric indicated a neutral to slightly negative probability relative to our baseline or “nominal” market probability.
We believe this tool provides valuable insights for assessing medium-term risk tolerance within a portfolio. When the market’s probability is neutral or slightly below the nominal baseline, we aim to construct portfolios that balance the opportunity to capture slight gains with protective measures to mitigate potential downside risks.
Looking ahead to next week, our quant model continues to produce similar outputs. While the probability of positive returns remains subdued, we cannot rule out the possibility of a sudden, sharp downward move in the markets, as certain vulnerabilities persist in our model’s data.
Disclaimer: The information provided here is for educational and informational purposes only and should not be interpreted as financial advice. I am not a licensed financial advisor, and my portfolio strategies may not align with your financial goals or risk tolerance. All investments carry inherent risks, including the potential loss of principal. Historical data and model-based projections are not guarantees of future performance. Please consult with a licensed financial professional before making any investment decisions.


Weekly Update 12.1.24
In last week’s update, we noted an unusual bullish wave occurring at an unexpected point in our signal’s historical cycle. While this deviation was unprecedented, it turned out to be a favorable opportunity for those positioned bullishly in the market. This serves as a reminder that no model is flawless, and the possibility of model errors must always be accounted for when constructing a portfolio.
Looking ahead to next week, our model suggests a reduced probability of positive returns. The nominal probability of positive return is approximately 63% (as indicated by the dashed line on the chart), reflecting a long-term trend of positive returns in the market. This baseline probability slightly exceeds a 50/50 scenario due to historical market behavior. However, our quantitative model places the probability of positive returns in the 50% range for the tracked indices, signaling caution for bullish market participants. We are observing signs of early fatigue in the current market wave. If the market continues higher, the model projects modest gains in the range of 1% to 1.4%.
Disclaimer: The information provided here is for educational and informational purposes only and should not be interpreted as financial advice. I am not a licensed financial advisor, and my portfolio strategies may not align with your financial goals or risk tolerance. All investments carry inherent risks, including the potential loss of principal. Historical data and model-based projections are not guarantees of future performance. Please consult with a licensed financial professional before making any investment decisions.


Weekly Update 11.23.24
This week the market made an unexpected and unpredicted pivot upward. Our signal did not achieve any of it’s historic indications of a pivot, so we cannot endorse this pivot as “high probability.” A market pivot at this point has not happened in the last 12 months. Therefore, we are not going to publish a forecast this week. We will watch next week and see if this bullish wave holds up, or it it turns out to be a bull trap. More to come!
Weekly Update 11.15.24
In last week’s update, we highlighted the potential for market exhaustion during this week. On Tuesday, we issued a market alert indicating that our model had identified exhaustion for the current wave. Following that alert, the market did, in fact, trend lower, closing out the week with a decline on Friday.
Looking ahead to next week, our model suggests that market momentum remains biased to the downside. At this time, we do not have any indications of a high-probability bullish entry point for the medium term. Should the signal or quantitative model show a significant shift during the week, we will issue a mid-week alert.
Disclaimer: The information provided here is for educational and informational purposes only and should not be construed as financial advice. I am not a licensed financial advisor, and my portfolio may not align with your financial goals or risk tolerance. All investments involve risk, including the potential loss of principal. Historical data and model-based projections do not guarantee future performance. Please consult a licensed financial professional before making any investment decisions.


Market Alert: Exhaustion
Today our signal detected market exhaustion following the major run-up following the election. Our AI quant model (shown below) now indicates a higher probability for market stagnation or decline over the coming days.
Disclaimer: The information presented here is for educational and informational purposes only and should not be construed as financial advice. I am not a licensed financial advisor, and my portfolio may not align with your financial goals or risk tolerance. All investments carry risks, including the potential loss of principal. Historical data and model-based projections are not guarantees of future performance. Always consult a licensed financial professional before making any investment decisions.

Weekly Market Update 11.9.24
This week’s market activity aligned closely with our projections from last weekend. We identified the beginning of a market pivot, anticipated some additional downside leading up to the election, and expected a highly responsive market following the election outcome. With the signal positioned to support significant upside momentum, the market reacted strongly once election certainty was established, resulting in a substantial upward move.
Looking ahead to next week, our model suggests that the likelihood of large upside moves has diminished. However, there remains potential for continued gains, though at a more moderate pace. If we observe signs of market exhaustion within this trend, we will issue a mid-week alert.
Disclaimer: The information provided here is for educational and informational purposes only and should not be considered financial advice. I am not a licensed financial advisor, and my portfolio may not align with your financial goals or risk tolerance. All investments involve risk, including the potential loss of principal. Historical data and model-based projections do not guarantee future performance. Please consult a licensed financial professional before making any investment decisions.


Market Alert: High Probability Pivot In Progress
This week’s market activity offered some fascinating dynamics. I anticipated a mid-week pivot, and at one point, it looked like the market might turn in advance of typical entry signals. However, by Friday, the market and our signal ultimately aligned, resulting in a more standard entry signal. Interestingly, our three tracked indices closed the week within just a few dollars of the projections published last Friday, reinforcing confidence in the model’s validity.
Currently, the model's outputs are indicating the start of a high-probability entry window. As shown in the table and charts below, there’s an 85.7% probability of a positive return over the next 14-day period. It’s worth noting that there could still be some downward movement as this window begins. Additionally, with the U.S. presidential election on Tuesday—one of the year’s most significant events—market dynamics could be particularly responsive. While some analysts on Bloomberg TV mentioned that markets appear to be pricing in a Republican win, it’s important to remember that our model operates independently of news events; it’s designed to focus purely on historical data patterns. Thus, regardless of the election outcome, the current setup suggests the potential for continued market upside in the days and weeks ahead.
Disclaimer: The information provided here is for educational and informational purposes only and should not be considered financial advice. I am not a licensed financial advisor, and my portfolio may not align with your financial goals or risk tolerance. All investments carry risk, including the potential loss of principal. Historical data and model-based projections do not guarantee future performance. Please consult a licensed financial professional before making any investment decisions.


Market Update 10.26.24
This week, we observed an early-week exhaustion pivot that altered our initial forecast from last weekend. Although the final outcomes remained within one standard deviation of our projections, the week’s actual performance diverged from Saturday’s model. In hindsight, a mid-week model update would have better reflected this pivot.
Recently, we’ve noticed a shift in the signal’s pattern, with an increased frequency of entry and exhaustion points, alongside shorter duration windows. This pattern shift brings both advantages and challenges: while it may present more opportunities for high-probability entries, the shorter windows may also reflect reduced market conviction. Trading volumes for major ETFs we track appear slightly lower than in previous months, which could be attributed to traders awaiting more clarity on economic policy with the election approaching.
Looking to next week, the signal currently indicates a potential mid-week pivot toward a high-probability bullish entry for a medium-term position. At the current rate of change, this pivot may occur within a couple of trading days. We may also see some correction in the Nasdaq 100, following patterns observed in other indices.
Once the pivot occurs, I will publish an updated model reflecting the anticipated directional shift. For now, I’ve highlighted the 7-day forecast lines below, as they are the most relevant at this stage.
Disclaimer: The information provided here is for educational and informational purposes only and should not be construed as financial advice. I am not a licensed financial advisor, and my portfolio may not align with your financial goals or risk tolerance. All investments involve risk, including potential principal loss. Historical data and model-based projections do not guarantee future performance. Please consult a licensed financial professional before making any investment decisions.


Market Alert.. Exhaustion Reached
Our signal started showing signs of early exhaustion last week, and this week it has confirmed medium term equity market exhaustion. More to follow in our weekend update.
Market update 10.19.24
This week’s market performance closely aligned with our model’s projections, which were published last weekend. DIA closed at 432.64 compared to our projected 433.47. SPY finished the week at 584.59, slightly below the projection of 584.79. Lastly, QQQ ended at 497.47, just under the expected 500.25. Overall, the model continues to show strong accuracy.
Based on the projected outcomes shown in the table and charts below, the data suggests that the bullish trend may continue. However, we are seeing early signs of exhaustion in the underlying signal. Large gains in the coming days and weeks seem unlikely. Instead, we anticipate a steady, gradual movement higher with fluctuations along the way. Should there be any significant changes in the signal’s direction or quality, we will issue an alert.
Disclaimer: The information presented here is for educational and informational purposes only and should not be construed as financial advice. I am not a licensed financial advisor, and my portfolio may not align with your financial goals or risk tolerance. All investments carry risks, including the potential loss of principal. Historical data and model-based projections are not guarantees of future performance. Always consult a licensed financial professional before making any investment decisions.


Market Pivot in Progress 10.12.24
This week’s market performance aligned with our expectations, with a couple of down days that helped generate our entry signal. I noted this signal on Instagram (@RedOakQuant) on October 9th, which marked the beginning of a high-probability entry window. Typically, our windows last several trading days, but this one seems to be closing quickly, and Monday is likely the final day.
Please note that while the maximum return window may have passed, there may still be opportunities for profitable trades. However, the data indicates that the potential for maximum gains has diminished. Based on historical performance models (as detailed in the table below), the data suggests there could be further upward momentum in the market over the coming weeks. Historically, we’ve seen a pattern of several strong days with 1% or greater gains, followed by a period of slower growth until the market reaches exhaustion.
It’s important to recognize that these insights are based on historical trends and models, which do not guarantee future performance. While the data suggests a higher probability of continued market gains, outcomes can always deviate from the expected pattern. Markets can reverse or experience volatility, even after favorable entry signals, although such a reversal does not appear likely in this specific situation.
Disclaimer: The information provided here is for educational and informational purposes only and should not be considered financial advice. I am not a licensed financial advisor, and my portfolio may not be appropriate for your financial goals or risk tolerance. All investments involve risk, including the potential loss of principal. Historical data and market models are not indicative of future results. Please consult with a licensed financial professional before making any investment decisions.


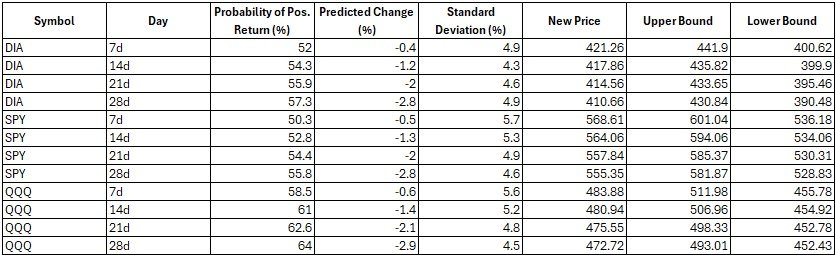
Pivot point incoming! Market update 10.5.24
Our model continues to perform well on the 7-day forecast. DIA closed the week at 423.41, nearly spot on with our predicted value of 421.26. SPY ended at 572.98, compared to a forecast of 568.61, while QQQ finished at 487.32, slightly ahead of the projected 483.88. All three were well within one-eighth of a standard deviation, demonstrating the accuracy of our model.
Looking ahead to next week... subscribe to continue reading!
Our model continues to perform well on the 7-day forecast. DIA closed the week at 423.41, nearly spot on with our predicted value of 421.26. SPY ended at 572.98, compared to a forecast of 568.61, while QQQ finished at 487.32, slightly ahead of the projected 483.88. All three were well within one-eighth of a standard deviation, demonstrating the accuracy of our model.
Looking ahead to next week, we're seeing a potential pivot point in the market. The probability of positive returns is increasing, especially beyond the 14-day outlook. However, our key underlying signal, which drives the model, suggests there may need to be one or two significant down days to align all the components for a strong bullish pivot. As a result, we anticipate some volatility during the week. If this volatility materializes, it will likely be followed by a robust recovery, presenting an ideal opportunity for a pivot point signal.


Market update 9.30.24
Market action this week aligned closely with our model's predictions, which we published on September 21, 2024. DIA ended the week at 422.95, compared to our forecast of 422.4. SPY closed at 571.47, slightly above the predicted 568.36, and QQQ finished at 486.77, just beyond of our projection of 483.41. All these results fell within less than a quarter of a standard deviation, reinforcing our confidence in the accuracy of the model's outputs.
Looking ahead to the coming trading week..... (subscribe to continue reading!)
Market action this week aligned closely with our model's predictions, which we published on September 21, 2024. DIA ended the week at 422.95, compared to our forecast of 422.4. SPY closed at 571.47, slightly above the predicted 568.36, and QQQ finished at 486.77, just beyond of our projection of 483.41. All these results fell within less than a quarter of a standard deviation, reinforcing our confidence in the accuracy of the model's outputs.
Looking ahead to the coming trading week, the model shows signs of weakness and caution. How the market performs will largely depend on whether it can recover quickly early in the week. If not, there are notable causes for concern. The outputs below reflect these potential risks, and in response, we have significantly de-risked our portfolio to safeguard accumulated gains.


Market Update 9.21.24
This week’s market action was marked by a notable event: the FOMC rate cut of 50 basis points. We published a mid-week update shortly before the announcement, explaining that we saw a 50/50 chance of gains versus losses. In response, we reduced our leveraged positions prior to the meeting while keeping our unleveraged index ETFs in place. This strategy minimized our risk exposure while still allowing us to benefit from potential market upside.
Despite the significant news, the model was spot-on with its weekly prediction, which was published last week. DIA was projected to end the week at 420.33, and the actual close on Friday was 420.57. SPY was projected to close at 568.75, with an actual close of 568.25. QQQ was projected to finish at 482.48, and the actual close was 482.44. These results are impressive.
Looking ahead to next week, the AI-derived model predicts...
This week’s market action was marked by a notable event: the FOMC rate cut of 50 basis points. We published a mid-week update shortly before the announcement, explaining that we saw a 50/50 chance of gains versus losses. In response, we reduced our leveraged positions prior to the meeting while keeping our unleveraged index ETFs in place. This strategy minimized our risk exposure while still allowing us to benefit from potential market upside.
Despite the significant news, the model was spot-on with its weekly prediction, which was published last week. DIA was projected to end the week at 420.33, and the actual close on Friday was 420.57. SPY was projected to close at 568.75, with an actual close of 568.25. QQQ was projected to finish at 482.48, and the actual close was 482.44. These results are impressive.
Looking ahead to next week, the AI-derived model predicts a relatively flat week-over-week change, with DIA expected to change by 0.2%, SPY by 0%, and QQQ by -0.2%. Notably, the probability of positive returns remains significantly high across all periods. Based on our interpretation, we believe the market may experience a slight "float up" in the coming weeks. While this doesn’t meet the criteria for one of our entry windows, we plan to participate using non-leveraged instruments.


Pre-FED Market Update
This is an out-of-cycle update, but given the situation it is warranted. Today the FED will announce their plans for interest rate changes. Our models are showing an elevated risk of downside moves. As reported on Bloomberg this morning, the market is pricing in a 50% chance of a 50 basis point reduction. This gives us concern, because if they deliver a 25 basis point reduction (which is widely believed to be the practical solution) there could be a negative market reaction. Therefore, we have removed our leveraged positions. Our non-leveraged index positions are still in-place.