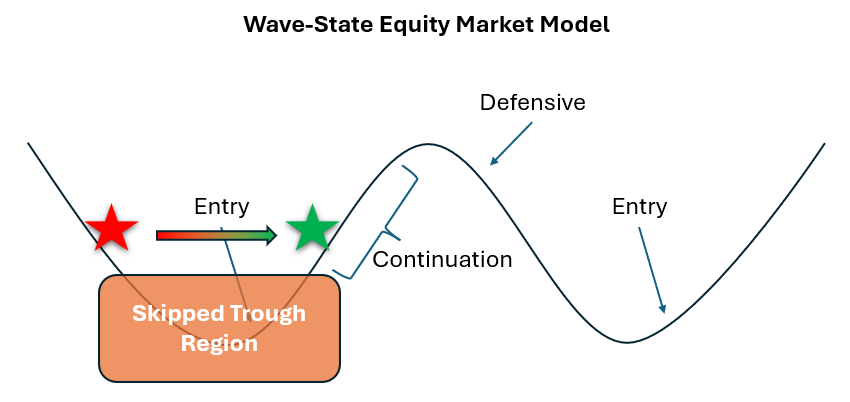
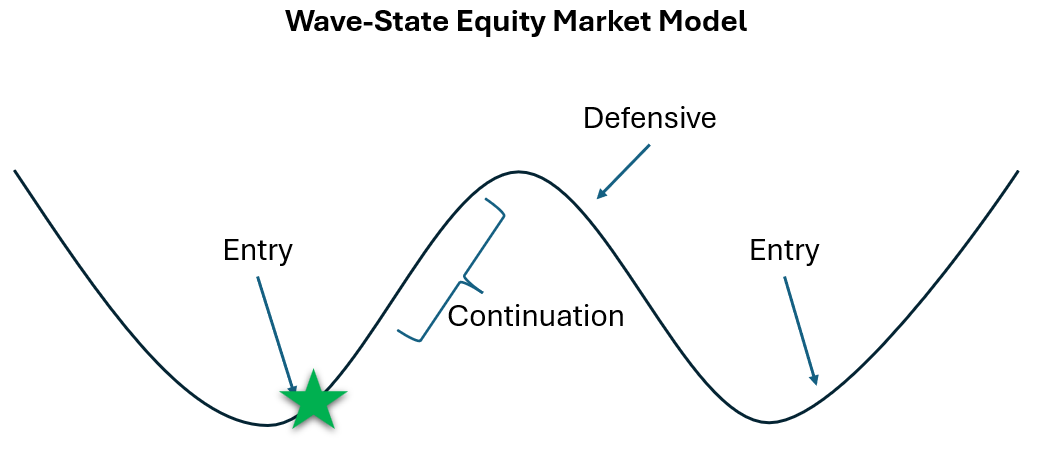
Transitioning to Bullish Continuation, With a Caveat
The model transitions to Bullish Continuation at Monday's open. The signal confirmed over two consecutive days, the breadth indicator cleared a key structural level for the first time this cycle, and the Defensive posture that the human override put in place last week did its job, cushioning Wednesday's sharp selloff before the market reversed sharply on geopolitical news Thursday and Friday.
The transition is called for per the ruleset, however this is not a clean wave setup.
The corrective phase that just ended never fully reset internally. The prior corrective cycle (the one that set up May's leveraged episode) produced a deep, sustained trough before recovering. This one didn't. The signal barely reached mid-range (about halfway down the wave slope) before the geopolitical catalyst pulled the market back up. That's not the internal structure that typically precedes a strong, sustained advance.
The BC allocation is the right posture given the signal. But the wave didn't fully consolidate, which means this advance may have less fuel behind it than the last one.
Where Things Stand
ROQ Portfolio (inception to date): +15.57%
S&P 500: +8.33%
EW4 Passive Benchmark: +11.98%
Alpha vs SPY: +7.24pp
Market analysis and this blog post were conducted and written with the assistance of AI analysis under human oversight.
The information provided here is for educational and informational purposes only and should not be considered financial advice. I am not a licensed financial advisor, and my portfolio may not be appropriate for your financial goals or risk tolerance. All investments involve risk, including the potential loss of principal. Historical data and market models are not indicative of future results. Please consult with a licensed financial professional before making any investment decisions.
ROQ Model Transitions To Defensive
Two significant model events occurred this week. The first was the clean close of the inaugural V3.0 leveraged episode. The second was the first activation of the human override module. Together, they illustrate how the ROQ model is designed to work, with mechanical rules and human judgment operating as a system.
The Leveraged Episode — Closed
The Bullish Entry position that opened May 22 ran for six trading days before the signal-based exit stop triggered on Monday, June 1. The stop executed exactly as designed, dropping the portfolio to the unleveraged Bullish Continuation allocation at Tuesday's open.
The final episode results:
May 22: +1.49% vs SPY +0.39%
May 26: +3.40% vs SPY +0.66%
May 27: −0.07% vs SPY −0.02%
May 28: +1.70% vs SPY +0.55%
May 29: +0.50% vs SPY +0.25%
June 1: +0.62% vs SPY +0.27%
Episode total: +7.85% leveraged vs SPY +2.13% — outperformance of +5.72pp in six trading days.
The stop exited the position at a natural top, capturing the gain and stepping aside when the signal deteriorated. That's exactly what it was designed to do.
The Human Override
After the leveraged episode closed, the portfolio held the unleveraged growth allocation through a volatile week that ended with a sharp, broad market selloff on Friday. Based on the internal signal structure and 15+ years of pattern recognition, conditions deteriorated in a way that warranted moving to Defensive ahead of the weekend rather than waiting for the mechanical rules to complete their normal cycle. The mechanical rules would have required one more day of downside to trigger a portfolio shift, but given the nature of what I’m observing, I decided to apply the human override a day earlier.
I activated the human override on Friday. The portfolio transitions to Defensive at Monday's open. As a reminder, Defensive means that we’re still fully invested in the market, just in a portfolio construction that historically minimizes losses during the down cycle of the wave.
The human override isn't a departure from the system… it's part of it. The model specification includes an explicit override module for exactly these situations, where judgment and experience can act faster than the mechanical rules allow. Using it transparently, with documentation, is how it was designed to be used.
Where Things Stand
ROQ Portfolio (inception to date): +14.38%
S&P 500: +7.72%
EW4 Passive Benchmark: +9.91%
Alpha vs SPY: +6.67pp
Friday's selloff trimmed the cumulative return. The Defensive allocation is now in place heading into next week.
Market analysis and this blog post were conducted and written with the assistance of AI analysis under human oversight.
The information provided here is for educational and informational purposes only and should not be considered financial advice. I am not a licensed financial advisor, and my portfolio may not be appropriate for your financial goals or risk tolerance. All investments involve risk, including the potential loss of principal. Historical data and market models are not indicative of future results. Please consult with a licensed financial professional before making any investment decisions.
ROQ Alert: Status Change, Leverage Removed
The ROQ Wave-State Model's first leveraged episode under Version 3.0 is now closed. The defensive stop triggered today, which calls for removing leverage at tomorrow's open and transitioning the portfolio to the unleveraged Bullish Continuation allocation. The episode ran six trading days, massively outperformed our benchmarks, and exited exactly as the rules prescribed. Here's the full account.
The Entry
The setup was described in last week's post. After nearly three weeks of base-building, the breadth signal and momentum indicator turned up sharply on Wednesday May 20. Thursday confirmed. The leveraged position engaged at Friday May 22's open with VIX at 16.90 — well clear of the gate.
The Episode
Six trading days. Here's how it played out:
May 22: +1.49% (portfolio) vs +0.39% (SPY)
May 26: +3.40% vs +0.66%
May 27: −0.07% vs −0.02%
May 28: +1.70% vs +0.55%
May 29: +0.50% vs +0.25%
June 1: +0.62% vs +0.27%
Episode total: +7.85% leveraged vs SPY +2.13% — outperformance of +5.72pp in six trading days.
The Stop Triggered Today
Friday May 29 both indicators declined simultaneously for the first time since entry. That was Day 1. Today, Monday June 1, both fell again. Day 2 confirmed. The stop triggered.
This is worth pausing on. The stop mechanism exists precisely for this moment — not to prevent losses, but to exit a leveraged position when the signal that justified it is no longer present. The position entered at deeply oversold levels, rode an orderly advance to overbought levels, and the stop found it at a natural top. That's the sequence working as intended.
Tomorrow's open the portfolio transitions to Bullish Continuation — same ETF allocation, no 3× instruments. The unleveraged growth posture stays in place until either the signal deteriorates into Defensive or a new Bullish Entry setup forms.
Where Things Stand
ROQ Portfolio (inception to date): +18.27%
S&P 500: +10.78%
EW4 Passive Benchmark: +12.93%
Alpha vs SPY: +7.49pp
The first V3.0 leveraged episode contributed approximately +6.96pp to the cumulative return. The remaining lead over SPY — built entirely through allocation rotation since December — now stands at +7.49pp in total. Both sources of alpha are on the scoreboard.
The model moves to Bullish Continuation tomorrow, and the model could quickly switch to Defensive. Watching for what comes next.
Market analysis and this blog post were conducted and written with the assistance of AI analysis under human oversight.
The information provided here is for educational and informational purposes only and should not be considered financial advice. I am not a licensed financial advisor, and my portfolio may not be appropriate for your financial goals or risk tolerance. All investments involve risk, including the potential loss of principal. Historical data and market models are not indicative of future results. Please consult with a licensed financial professional before making any investment decisions.
A New Version, A New Signal
The ROQ Wave-State Model has done exactly what it was designed to do since its inception in December 2025. By rotating tactically between a defensive allocation and a growth-oriented allocation, guided entirely by the internal structure of the market rather than price prediction, the portfolio has outperformed the S&P 500 through allocation discipline alone. Just systematic rotation based on measurable probabilities derived from the signal.
That foundation is solid. And after several months of live operation, I went back to the data to ask whether the model could be improved.
The Upgrade
After extensive backtesting across ten years of historical data, I've revised the ruleset that governs ROQ portfolio construction. Version 3.0 expands the conditions under which the model will deploy leverage, adds a hard volatility gate requiring VIX below 20 at any leverage entry, and introduces a signal-based exit stop that automatically removes leverage if both indicators deteriorate simultaneously for two consecutive days. The result is a more responsive model with better downside protection built in.
The numbers speak for themselves. Against the S&P 500 over ten years:
Cumulative return: V3.0 +692% vs S&P 500 +239%
Annualized return: V3.0 23.2% vs S&P 500 13.1%
Maximum drawdown: V3.0 −34.7% vs S&P 500 −34.1%
Sharpe Ratio: V3.0 0.916 vs S&P 500 0.485
Sortino Ratio: V3.0 1.176 vs S&P 500 0.588
Calmar Ratio: V3.0 0.544 vs S&P 500 0.258
Better returns. Better risk metrics. Same maximum drawdown (which occurred during the COVID-19 pandemic.) Every metric improved without adding tail risk. That's a rare combination and the reason I'm confident making the change.
I applied V3.0 retroactively to the actual live period data that the model had never seen. It would have returned +15.82% versus the +11.42% actually recorded, with the additional return coming from four specific leveraged days the original criteria missed. That out-of-sample check gave me the confidence to move forward.
Today's Signal
This week, the model produced its first Bullish Entry signal under V3.0 criteria. After nearly three weeks of base-building, the momentum indicator was grinding along deeply oversold levels while the market moved modestly higher. Both the breadth signal and momentum turned up sharply on Wednesday, confirmed on Thursday, and the leveraged position was engaged at Friday's open. VIX was sitting at 16.90, well clear of the gate. The setup was clean.
Friday returned +1.19% on the leveraged portfolio versus the S&P 500's +0.39%. The position remains open heading into next week, with both indicators still rising and the stop not triggered.
Where Things Stand
ROQ Portfolio (inception to date): +11.29%
S&P 500: +8.90%
EW4 Passive Benchmark: +10.81%
Market analysis and this blog post were conducted and written with the assistance of AI analysis under human oversight.
The information provided here is for educational and informational purposes only and should not be considered financial advice. I am not a licensed financial advisor, and my portfolio may not be appropriate for your financial goals or risk tolerance. All investments involve risk, including the potential loss of principal. Historical data and market models are not indicative of future results. Please consult with a licensed financial professional before making any investment decisions.
Defensive Shift Protects Downside
The ROQ Wave-State Model shifted to a Defensive posture at the open of May 12, completing a textbook transition that began with the first deteriorating signal on May 8. What made this transition notable wasn't just the outcome, it was the process.
The two-day cooldown rule is designed precisely for moments like this. When the signal first turned negative on May 8, the model held its Bullish Continuation allocation rather than reacting immediately. May 11 confirmed the deterioration, satisfying the cooldown and triggering the transition at the following open. That discipline was validated almost immediately: May 14 produced a brief one-day bounce in both indicators that looked like a potential recovery. Without the cooldown rule, the model would have rotated back to a growth posture, only to reverse sharply the very next day when the defensive signal resumed. The rule earned its keep.
The Defensive allocation (40% SPY, 40% DIA, 15% QQQ, 5% IWM) isn't a retreat from the market. The portfolio remained fully invested throughout, rotating toward a more balanced, stability-oriented mix. That positioning cushioned the week's roughest day on May 15, when a broad selloff hit small caps particularly hard, without sacrificing participation on the positive days earlier in the week.
Now 112 trading days into the live track record, the numbers are beginning to tell a story worth examining:
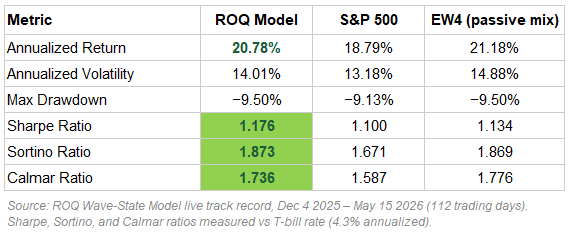
The comparison to SPY is straightforward: better return, better risk-adjusted performance across every measure. The comparison to EW4 requires a bit more context. EW4 is a passive, equal-weighted mix of the same four ETFs the model uses, rebalanced daily and never adjusted. It’s slightly higher raw return reflects a permanent tilt toward the more aggressive names in the portfolio. The model, by design, periodically rotates away from those names when conditions deteriorate.
What the numbers show is that this tactical rotation, the active work the model does, produces a comparable risk-adjusted result to simply holding everything equally, while doing so with meaningfully less day-to-day volatility. The model's Sortino Ratio of 1.873 essentially matches EW4's 1.869 with 87 basis points less annualized volatility. That is the early signature of the tactical approach working: similar reward, smoother ride.
The more compelling test will come in a genuine sustained downturn. EW4's permanent overweight to the high-octane names will amplify losses in that environment in a way the model's Defensive rotation is specifically designed to avoid. That chapter hasn't been written in the live period yet — but the mechanics are in place and, as this week demonstrated, functioning as intended.
The signals will tell us when conditions improve enough to shift back to offense.
Market analysis and this blog post were conducted and written with the assistance of AI analysis under human oversight.
The information provided here is for educational and informational purposes only and should not be considered financial advice. I am not a licensed financial advisor, and my portfolio may not be appropriate for your financial goals or risk tolerance. All investments involve risk, including the potential loss of principal. Historical data and market models are not indicative of future results. Please consult with a licensed financial professional before making any investment decisions.
Market Alert: ROQ portfolio switches to Defensive-Long status
Despite a positive day for equity market indexes, the ROQ signal showed further deterioration below the surface. This was day two of the required transition period, which dictates a change in portfolio construction. The change will take effect at the market open tomorrow.
Strong Week, But Defensive Signal Forming
Markets delivered another week of gains, with major indexes grinding higher despite choppy underlying momentum. The Wave-State Model captured the upside with the portfolio outperforming SPY by 76 basis points, though structural fragility beneath the rally triggered a defensive signal on Friday that could lead to repositioning next week.
The portfolio returned +3.11% for the week ending May 8 versus SPY's +2.35% and the equal-weight benchmark's +2.45%. The bullish allocation maintained since May 1 proved effective at capturing the rally, with higher exposure to growth and small-cap components providing the incremental performance edge. Week-to-week volatility was notable—SPY oscillated between a -0.37% decline on Monday and a +1.39% surge on Wednesday—but the framework's positioning stayed consistent throughout the chop.
However, Friday's session brought the first warning signal that the rally may be losing structural support. Both breadth and momentum indicators declined simultaneously, meeting the framework's criteria for a defensive trigger. This marks day one of a two-day confirmation period required before the portfolio shifts to a more conservative allocation. If the signal holds through Monday's session, the framework will transition to defensive positioning at Tuesday's open, reducing exposure to growth-oriented components ahead of a potential pullback.
The concern stems from the rally's character rather than its magnitude. While SPY has pushed to new highs, the advance shows signs of exhaustion on longer timeframes. Growth stocks have extended significantly from their moving averages following a near-vertical six-week rally, yet momentum indicators are failing to confirm the price action. This divergence between price and structure, where indexes make new highs without corresponding breadth or momentum confirmation, creates conditions where even modest weakness can accelerate quickly. The framework's defensive signal is responding to this structural fragility, positioning ahead of a potential mean-reversion move rather than reacting to it after the fact.
Since inception in early December, the Wave-State Model has delivered +8.86% versus SPY's +7.73% and the equal-weight benchmark's +9.62%. The portfolio has now moved into positive alpha territory against SPY (+1.13%), though it continues to trail the equal-weight allocation that maintains constant exposure to growth and small-cap components. The tactical framework's ability to outperform during this week's volatile conditions while generating the defensive signal before visible weakness validates the approach of using momentum and breadth structure to time positioning shifts rather than reacting to price declines.
QQQ has seen a moonshot upward thrust, caution is advised.
Performance Summary:
Week (May 1-8): ROQ +3.11% vs SPY +2.35% vs EW4 +2.45%
Since Inception (Dec 3 - May 8): ROQ +8.86% vs SPY +7.73% vs EW4 +9.62%
Author note: Market analysis and this blog post were conducted and written with the assistance of AI analysis under human oversight.
Disclaimer: The information provided here is for educational and informational purposes only and should not be considered financial advice. I am not a licensed financial advisor, and my portfolio may not be appropriate for your financial goals or risk tolerance. All investments involve risk, including the potential loss of principal. Historical data and market models are not indicative of future results. Please consult with a licensed financial professional before making any investment decisions.
Consolidation Complete, Framework Switches Bullish
Markets completed a brief but textbook consolidation over the past week, building the foundation for what appears to be a resumption of the broader uptrend. After spending much of April in defensive positioning as wave structure compressed from extreme overbought levels, the framework transitioned to a more aggressive allocation on May 1 as internal momentum confirmed a turn off deeply oversold readings.
From April 24 through May 1, the portfolio delivered +1.24% versus SPY's +0.94% and the equal-weight benchmark's +1.01%. The period included a sharp trough formation on April 29, when momentum readings reached extreme oversold levels reminiscent of the March geopolitical selloff. The framework remained defensive through the consolidation, then pivoted to its bullish allocation as both breadth and momentum indicators reversed higher. The transition occurred at the open on May 1, positioning the portfolio to participate in the rally that emerged from the reset.
The consolidation followed the pattern expected after extended rallies: wave structure compressed through time rather than price, with the market digesting gains while underlying support held. Moving averages continued rising throughout the period, confirming that the pullback was consolidation within an uptrend rather than the start of a reversal. The framework's response—defensive during compression, aggressive as structure confirmed the turn—aligned with how tactical allocation should function during healthy corrections.
Since inception in early December, the Wave-State Model has delivered +5.57% versus SPY's +5.25% and the equal-weight benchmark's +7.00%. The portfolio continues to beat SPY through multiple market regimes while trailing the equal-weight allocation that maintains constant exposure to growth and small caps. This performance spread reflects the trade-off inherent in tactical frameworks: risk management during drawdowns in exchange for some opportunity cost during sustained rallies. The framework now holds a more aggressive allocation as structure supports continued participation in the uptrend.
Performance Summary:
Week Period (Apr 24 - May 1): ROQ +1.24% vs SPY +0.94% vs EW4 +1.01%
Since Inception (Dec 3 - May 1): ROQ +5.57% vs SPY +5.25% vs EW4 +7.00%

Author note: Market analysis and this blog post were conducted and written with the assistance of AI analysis under human oversight.
Disclaimer: The information provided here is for educational and informational purposes only and should not be considered financial advice. I am not a licensed financial advisor, and my portfolio may not be appropriate for your financial goals or risk tolerance. All investments involve risk, including the potential loss of principal. Historical data and market models are not indicative of future results. Please consult with a licensed financial professional before making any investment decisions.
Wave Compression: Consolidation After Strong Rally
The past two weeks have demonstrated an important aspect of wave-based momentum frameworks: strong rallies often require periods of consolidation where internal structure resets even as prices hold steady or continue higher. Markets extended the recovery from the March geopolitical selloff, with SPY rallying over 5% from early April through mid-month before entering a healthy consolidation phase. The framework navigated this period with multiple state transitions as momentum oscillators worked off extreme overbought conditions.
From April 10 through April 24, the portfolio delivered approximately +4.65% versus SPY's +5.07%, underperforming by roughly 40 basis points during this rapid advance. The underperformance came from defensive positioning during key portions of the rally—the framework remained in its defensive allocation from April 7-13 as wave structure signaled caution, then briefly shifted to a more aggressive posture from April 14-20 before returning to defensive positioning on April 21. The wave structure peaked on April 17 with momentum readings in extreme overbought territory, then began compressing over the following week as the market consolidated gains. Interestingly, SPY actually gained ground during this consolidation phase even as internal breadth and momentum readings fell significantly, illustrating how wave compression can occur through time rather than price.
The current consolidation is markedly different from the March trough. During March, the wave structure collapsed into deeply oversold territory as moving averages rolled over and breadth deteriorated across the board. The current environment shows wave readings compressing from extreme highs while the underlying trend structure—captured by rising 20-day moving averages—remains intact. This type of consolidation typically resolves more quickly than trough formations because the framework is digesting gains rather than repairing damage. The defensive positioning provides downside protection if consolidation turns into correction, while keeping the portfolio positioned to capture any resumption of the uptrend when structure confirms.
Since inception in early December, the Wave-State Model has delivered approximately +4.40% versus SPY's +4.39%, essentially matching the benchmark through significant volatility and multiple market regimes, while structurally de-risking the portfolio at the appropriate times. The framework has now navigated a major geopolitical selloff, a violent recovery rally, and a consolidation phase with state transitions occurring as structure dictated. The goal remains consistent risk management that preserves capital during adverse conditions and participates when opportunities emerge, even if execution isn't perfect during every market phase.
Performance Summary:
Two-Week Period (Apr 10-24): ROQ +4.65% vs SPY +5.07% (-0.42% underperformance)
Since Inception (Dec 3 - Apr 24): ROQ +4.40% vs SPY +4.39% (+0.01% outperformance)
Author note: Market analysis and this blog post were conducted and written with the assistance of AI analysis under human oversight.
Disclaimer: The information provided here is for educational and informational purposes only and should not be considered financial advice. I am not a licensed financial advisor, and my portfolio may not be appropriate for your financial goals or risk tolerance. All investments involve risk, including the potential loss of principal. Historical data and market models are not indicative of future results. Please consult with a licensed financial professional before making any investment decisions.
Navigating Geopolitical Volatility: Framework Delivers Through Market Extremes
The past two months have tested every dimension of the Wave-State framework. From late February through early April, markets grappled with escalating Middle East tensions that drove extreme volatility, a near 10% drawdown followed by a sharp 5% recovery in less than four weeks. The framework navigated this turbulent period without trying to predict headlines or trade geopolitical developments, relying instead on market structure to manage risk and capture opportunity.
The portfolio entered defensive positioning in late February as internal breadth and momentum deteriorated, well before geopolitical fears peaked. Markets bottomed on March 20 at SPY $648.57, having declined nearly 10% from recent highs. The wave structure spent three weeks building a proper trough in deeply oversold territory before reversing sharply higher. From the March 17 trough through April 10, the portfolio delivered +1.61% versus SPY's +1.29%, capturing the recovery while managing through five state transitions as volatility remained elevated. The defensive period from February 24 through March 17 underperformed by -0.62% as growth and small-cap segments within the defensive allocation were hit harder than large caps, but the positioning successfully limited exposure during the peak of the selloff.
The recovery phase proved challenging from an execution standpoint. The wave structure reversed violently—momentum surged 38 points and oscillator readings swung from single digits to extreme overbought levels in just three weeks. This created whipsaw conditions where the framework shifted between defensive and aggressive postures multiple times as signals triggered, cooled down, and reversed. The framework doesn't trade headlines or attempt to anticipate geopolitical resolution. It responds to what markets are doing, not what might happen next. In this case, the signals provided structure during a period when headline-driven volatility would have been nearly impossible to navigate through discretion alone.
Since inception in early December, the Wave-State Model has delivered -0.24% versus SPY's -0.65%, maintaining a +0.41% edge through multiple market cycles and significant geopolitical disruption. The framework's strength isn't perfection during every market phase; it's consistent risk management that preserves capital during drawdowns and captures recoveries when the structure confirms. The past two months demonstrated both: defensive positioning during the worst of the decline, followed by participation in the recovery despite choppy execution.
Performance Summary:
Since Inception (Dec 3 - Apr 10): ROQ -0.24% vs SPY -0.65% (+0.41% outperformance)
Trough Period (Feb 24 - Mar 17): ROQ -3.03% vs SPY -2.41% (-0.62% underperformance during selloff)
Recovery Period (Mar 17 - Apr 10): ROQ +1.61% vs SPY +1.29% (+0.32% outperformance)
Author note: Market analysis and this blog post were conducted and written with the assistance of AI analysis under human oversight.
Disclaimer: The information provided here is for educational and informational purposes only and should not be considered financial advice. I am not a licensed financial advisor, and my portfolio may not be appropriate for your financial goals or risk tolerance. All investments involve risk, including the potential loss of principal. Historical data and market models are not indicative of future results. Please consult with a licensed financial professional before making any investment decisions.
Wave Structure Improving, Portfolio Positioned for Participation
This week delivered what the Wave-State framework has been waiting for: sustained momentum confirming the market is building strength off the trough. After two weeks of choppy action following the shift to a more aggressive allocation, the underlying structure has finally started to cooperate.
From February 13 through February 20, SPY gained +1.13%. The portfolio gained +0.94% during the week, underperforming SPY by a small margin as the rally was led more by large caps than by the growth and small-cap segments where the aggressive allocation is tilted. The important development isn't the weekly performance, it's the wave structure. After spending most of February testing whether the trough had truly formed, the market has now delivered sustained rising momentum and strengthening participation across indexes. This is what the framework looks for when assessing whether a wave has exited the bottom.
Since shifting to the aggressive allocation on February 11, the portfolio is down -0.52% versus SPY's -0.39%. That modest underperformance reflects the timing of the shift—it came just ahead of a sharp selloff on February 12, followed by consolidation before this week's rally materialized. The framework stayed disciplined through that volatility and is now positioned to participate as the wave builds.
Since its inception in early December, the portfolio is up +1.71% versus SPY's +0.81%, for +0.90% of outperformance. The edge continues to come primarily from the defensive period in late January and early February, which successfully preserved capital during the trough-building phase. The aggressive positioning over the past two weeks has been flat to slightly negative relative to the benchmark, but the structure is improving and the framework remains patient.
The goal isn't perfection—it's alignment. The defensive shift in late January worked because it recognized the wave was rolling over and needed time to build a base. The shift back to aggressive positioning on February 11 was early, but the framework doesn't demand perfect entries. It demands staying invested, managing risk, and positioning the portfolio to capture the next leg when the structure confirms. This week, the structure confirmed.
Author note: Market analysis and this blog post were conducted and written with the assistance of AI analysis under human oversight.
Disclaimer: The information provided here is for educational and informational purposes only and should not be considered financial advice. I am not a licensed financial advisor, and my portfolio may not be appropriate for your financial goals or risk tolerance. All investments involve risk, including the potential loss of principal. Historical data and market models are not indicative of future results. Please consult with a licensed financial professional before making any investment decisions.
Defensive Wins, Aggressive Doesn't Lose, Outperformance Since Inception
Over the past three weeks, the Wave-State portfolio has delivered a useful case study in tactical allocation. From late January through early February, a defensive posture protected capital during volatile, choppy action. Then, after shifting to a more aggressive stance on February 11, the market immediately sold off. The result? The defensive period worked brilliantly. The aggressive period didn't matter.
From January 28 through February 9, the portfolio operated in a conservative configuration—tilted toward large-cap, stable indexes while reducing exposure to growth and small caps. During those two weeks, the portfolio posted +0.31% while SPY declined -0.22%. That's +0.53% of outperformance during a period where the broader market was losing ground. The wave was building its trough, volatility was elevated, and the framework correctly prioritized preservation over participation.
Then, on February 11, the signal structure looked strong enough to warrant a shift back to a more aggressive allocation—increasing exposure to QQQ and small caps while reducing the defensive tilt. Markets sold off sharply on Thursday, and the portfolio absorbed a -1.79% loss on the day. Friday brought a modest bounce (+0.37%), but the damage was done. Over the three-day aggressive period (February 11-13), the portfolio declined -1.45% versus SPY's -1.50%.
Here's the interesting part: if the portfolio had just stayed defensive through the entire week, it would have lost -1.42% vs the observed -1.45%. The shift to the aggressive allocation cost roughly three basis points versus doing nothing. In other words, the switch didn't matter. It didn't help, it didn't hurt—it was noise.
This is an important lesson. The value of tactical allocation doesn't come from perfectly timing every move. It comes from getting the big structural calls right and avoiding catastrophic mistakes. The defensive shift in late January worked—it protected capital when the market was weak, outperformed during choppy conditions, and positioned the portfolio to participate when conditions improved. The shift back to aggressive positioning on February 11 turned out to be early, but it didn't damage the portfolio. The framework stayed disciplined, absorbed the volatility, and moved on.
Since inception in early December, the portfolio is up +0.76% versus SPY's -0.31%, for +1.08% of outperformance. Nearly all of that edge came from the defensive period. The aggressive period has been flat to slightly negative relative to staying conservative. That's fine. Not every decision will add value, but as long as the big structural calls work—like recognizing when a trough is forming and pulling back exposure—the framework does its job.
The portfolio remains in its current allocation as we head into next week. The wave is still choppy, the signal is still building its base, and the priority is staying invested while managing risk. The goal isn't to be a hero on every trade. It's to beat the market over time by recognizing when conditions favor aggression and when they don't.
Author note: Market analysis and this blog post were conducted and written with the assistance of AI analysis under human oversight.
Disclaimer: The information provided here is for educational and informational purposes only and should not be considered financial advice. I am not a licensed financial advisor, and my portfolio may not be appropriate for your financial goals or risk tolerance. All investments involve risk, including the potential loss of principal. Historical data and market models are not indicative of future results. Please consult with a licensed financial professional before making any investment decisions.
Market Alert: Research Portfolio Switches to Bullish-Continuation
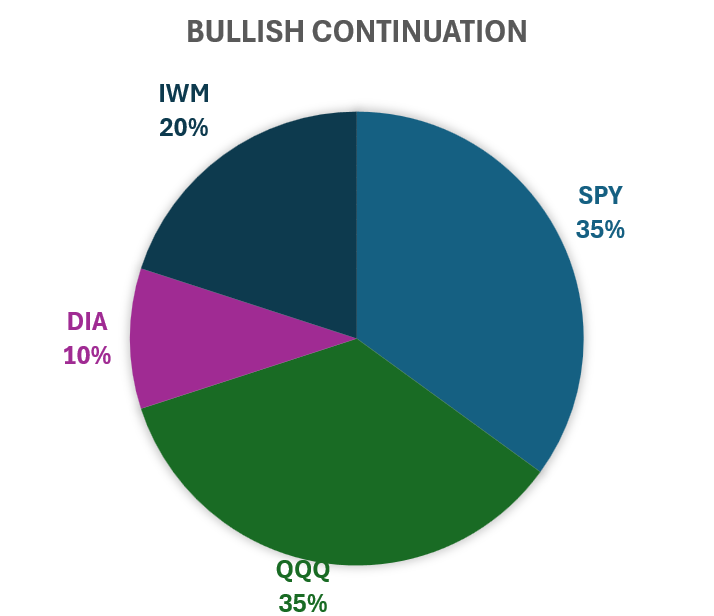
Effective at the open on February 11, the portfolio will shift from a Defensive posture into a Bullish Continuation configuration, reflecting evidence from our internal wave-state framework that a new up-leg is forming after the recent down-wave and flush. This change increases exposure to growth and small caps, moving to 35% SPY, 10% DIA, 35% QQQ, and 20% IWM, with no leverage, cash, or volatility positions. In short, the goal of this adjustment is to move from “cushioning downside” back toward “participating more fully in upside” now that breadth, momentum, and volatility have collectively transitioned from stress conditions into a more constructive regime.
Author note: Market analysis and this blog post were conducted and written by Red Oak Quant’s custom AI Agent with human oversight.
Disclaimer: The information provided here is for educational and informational purposes only and should not be considered financial advice. I am not a licensed financial advisor, and my portfolio may not be appropriate for your financial goals or risk tolerance. All investments involve risk, including the potential loss of principal. Historical data and market models are not indicative of future results. Please consult with a licensed financial professional before making any investment decisions.
Defensive Shift Cut Losses by 96%
Over the past ten trading days, the Wave-State portfolio did exactly what it was designed to do: it cut losses by roughly 96% compared to staying aggressive.
From January 28 (the date of the Defensive flip) through February 6, the Defensive portfolio posted a return of +0.10%—essentially flat despite significant market chop. Compare that to what happened elsewhere:
SPY declined -0.70%
Equal-weight basket (SPY/DIA/QQQ/IWM) fell -0.45%
Staying in the prior Bullish Continuation stance would have lost -1.18%
The defensive posture protected against 1.28% of additional losses. In a choppy, weakening tape, that difference is meaningful—it's the portfolio taking about 4% of the hit that a more aggressive posture would have absorbed.
The reason for the shift was straightforward. After a strong advance earlier in the month, the internal structure of the market began to deteriorate. The wave had rolled over from its peak and was entering a trough phase. By mid-week on January 28, conditions had weakened enough that the framework called for a move into a more conservative configuration: 40% SPY, 40% DIA, 15% QQQ, and 5% IWM.
Importantly, this was not a call to abandon the market. The goal was to recognize that the balance between risk and reward had shifted—downside risk had become more significant than the remaining upside potential. The Defensive allocation is tilted toward large-cap, stable indexes while reducing exposure to higher-beta segments that tend to sell off more sharply during weakness. It keeps you fully invested, just positioned differently.
For now, the wave remains in a trough-building phase, despite the impressive rally on Friday. The portfolio will stay in its Defensive configuration until the underlying structure improves and both breadth and momentum turn back up in a synchronized way. When that happens, the framework will shift back toward a more aggressive stance. Until then, the focus is on continuing to participate in the market while cushioning the impact of this phase of the wave.
Since the beginning of December (when the Wave-State was publicly introduced), the Wave-State Model has delivered a +2.18% return, outpacing SPY's +0.98% by +1.19%. The past ten days validated the framework. The Defensive shift worked exactly as designed.
Author note: Market analysis and this blog post were conducted and written with the assistance of AI analysis under human oversight.
Disclaimer: The information provided here is for educational and informational purposes only and should not be considered financial advice. I am not a licensed financial advisor, and my portfolio may not be appropriate for your financial goals or risk tolerance. All investments involve risk, including the potential loss of principal. Historical data and market models are not indicative of future results. Please consult with a licensed financial professional before making any investment decisions.
Defensive Shift Cut Weekly Losses Almost in Half
This week’s portfolio shift did exactly what it was designed to do: it cut losses by roughly 40–50% compared to staying aggressive or simply holding an equal-weight mix of the major U.S. index ETFs.
From January 28 through January 30, the Defensive portfolio declined about -0.6%, while a hypothetical portfolio that stayed in the prior Bullish Continuation stance would have been down roughly -1.1%, and an equal-weight basket of SPY, DIA, QQQ, and IWM lost about -1.0% over the same stretch. In a choppy, weakening tape, that difference is meaningful—it’s the portfolio taking about half the hit that a more aggressive posture would have absorbed.
The reason for the shift was straightforward. After a strong advance off the last trough and a late-stage bounce, the internal structure of the market began to deteriorate. Momentum and breadth cooled from “hot” to clearly weak, and growth and small caps started to underperform. By mid-week, the wave had rolled over enough that the framework called for a move out of the prior Bullish Continuation stance and into a more conservative configuration. That transition took effect at the open on Wednesday, January 28, with the portfolio rebalanced into a Defensive Long allocation tilted 40% to SPY, 40% to DIA, 15% to QQQ, and 5% to IWM.
Importantly, this wasn’t a call to abandon the market. The goal was to recognize that the balance between risk and reward had flipped: downside risk had become more significant than the remaining upside potential. As the week progressed, that judgment was validated. Friday’s close showed further broad-based weakness, with large caps, growth, and small caps all under pressure, and the internal readings now characterize this as a genuine down-leg rather than a shallow pullback.
For now, the wave remains in a Defensive state as we enter the trough of the wave. The portfolio will stay in its Defensive configuration until the underlying structure improves; specifically, until the indicators that govern the wave suggest that downside pressure has exhausted itself and a new, higher-probability advance is forming.
Typically, the trough takes several trading days to a couple of weeks to develop. During this time, meaningful declines are probable, but not guaranteed. In the meantime, the focus is on continuing to participate in the market while cushioning the impact of this phase of the wave as much as possible.
Author note: Market analysis and this blog post were conducted and written by Red Oak Quant’s custom AI Agent with human oversight.
Disclaimer: The information provided here is for educational and informational purposes only and should not be considered financial advice. I am not a licensed financial advisor, and my portfolio may not be appropriate for your financial goals or risk tolerance. All investments involve risk, including the potential loss of principal. Historical data and market models are not indicative of future results. Please consult with a licensed financial professional before making any investment decisions.
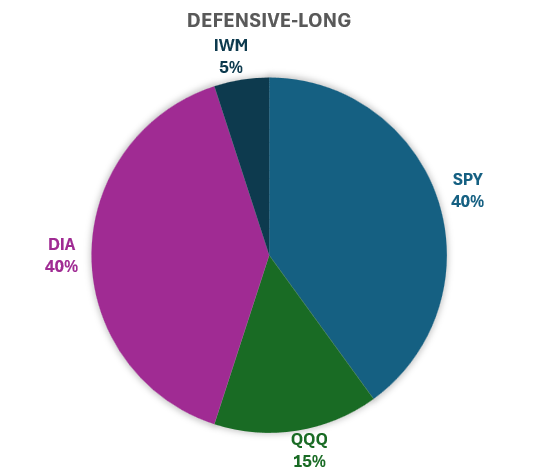
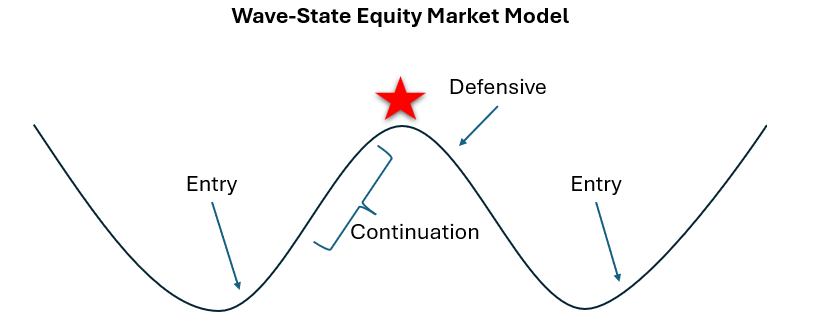
Market Alert: Defensive-Long Portfolio Now Called For
Markets have now moved from a late-stage bounce into a more fragile phase, and the internal structure of the wave has weakened enough that the model has shifted from Bullish Continuation to a Defensive Long stance. While the major indexes (SPY, DIA, QQQ, IWM) have not experienced a dramatic breakdown, the underlying signals we track (especially momentum, breadth, and the recent rollover in small caps) now point to elevated drawdown risk relative to remaining upside. As a result, the research portfolio has been reallocated away from growth and small-cap exposure and into a more conservative mix tilted toward SPY and DIA, with reduced weights in QQQ and IWM. Weights are shown in the pie chart below.
The goal is to stay invested in the U.S. equity market while acknowledging that this wave appears to have rolled over from its prior peak, and that capital is now better served in a Defensive configuration until the next favorable wave-state emerges.
Author note: Market analysis and this blog post were conducted and written by Red Oak Quant’s custom AI Agent with human oversight.
Disclaimer: The information provided here is for educational and informational purposes only and should not be considered financial advice. I am not a licensed financial advisor, and my portfolio may not be appropriate for your financial goals or risk tolerance. All investments involve risk, including the potential loss of principal. Historical data and market models are not indicative of future results. Please consult with a licensed financial professional before making any investment decisions.
Markets Pull Off A Late Stage Bounce, But Vulnerability Remains
Over the past couple weeks, the U.S. equity market has followed a fairly textbook pattern for a mature wave. After a strong advance off the prior trough, internal measures of breadth and momentum pushed into “hot” territory, especially in the small-cap space. That’s typically where the structure becomes more vulnerable to a drawdown, and we finally saw that vulnerability show up in price last week.
Following those peak conditions, the market experienced a sharp pullback, with all four major indexes (SPY, DIA, QQQ, and IWM) moving lower and volatility briefly moving higher. From the perspective of the wave, this looked less like a surprise event and more like the natural cooling that tends to follow an extended, overbought phase.
Since then, we’ve seen a bounce from that decline. Large-cap indexes like SPY, DIA, and QQQ have recovered a meaningful portion of the drop and, on the surface, still look reasonably strong. However, Friday’s trading session revealed an important nuance: small caps showed notable relative weakness. While the large-cap benchmarks held up, IWM lagged and struggled to participate in the rebound to the same extent. Historically, that type of divergence can serve as an early warning. When small caps begin to underperform after leading earlier in the wave, it often signals that risk appetite is fading and that the wave may be transitioning from “strong and extended” toward a more fragile, late-stage phase.
From a portfolio standpoint, this keeps us in a Bullish Continuation stance, but without leverage. The model still views the environment as broadly bullish, and the data do not yet justify a full shift into a Defensive regime. At the same time, the combination of prior overbought conditions, a sharp pullback, a less convincing rebound, and emerging small-cap underperformance argues against increasing risk into this strength. Instead, the focus is on staying fully invested across the major U.S. equity indexes while watching closely to see whether this small-cap weakness remains a brief wobble or develops into a more persistent leadership change that would confirm the wave is rolling over into a more defensive phase.
As always, the goal is not to predict every short-term move, but to keep portfolio construction aligned with where we are in the wave: strong enough to stay invested, but mature enough to treat this environment with caution and respect the early warning signs that are starting to appear under the surface.
Author note: Market analysis and this blog post were conducted and written by Red Oak Quant’s custom AI Agent with human oversight.
Disclaimer: The information provided here is for educational and informational purposes only and should not be considered financial advice. I am not a licensed financial advisor, and my portfolio may not be appropriate for your financial goals or risk tolerance. All investments involve risk, including the potential loss of principal. Historical data and market models are not indicative of future results. Please consult with a licensed financial professional before making any investment decisions.
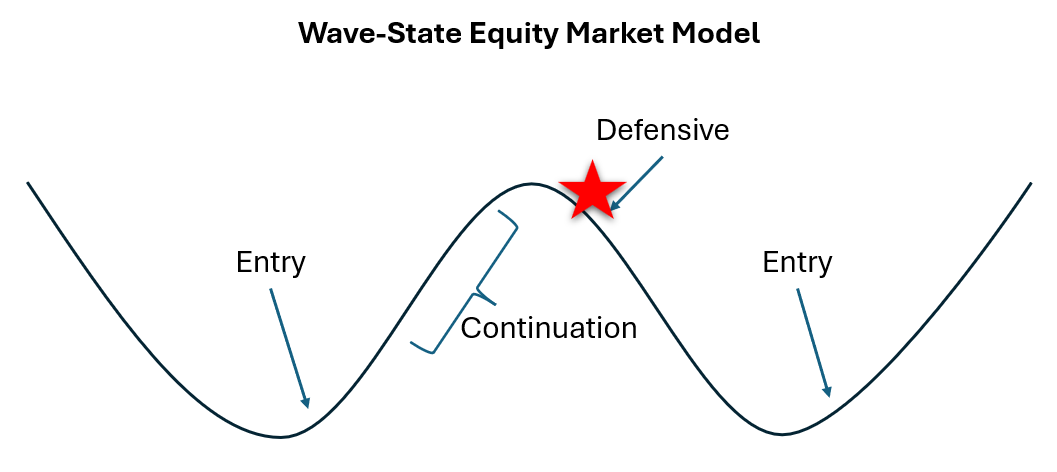
Market Pulls Back As Expected; Will It Continue?
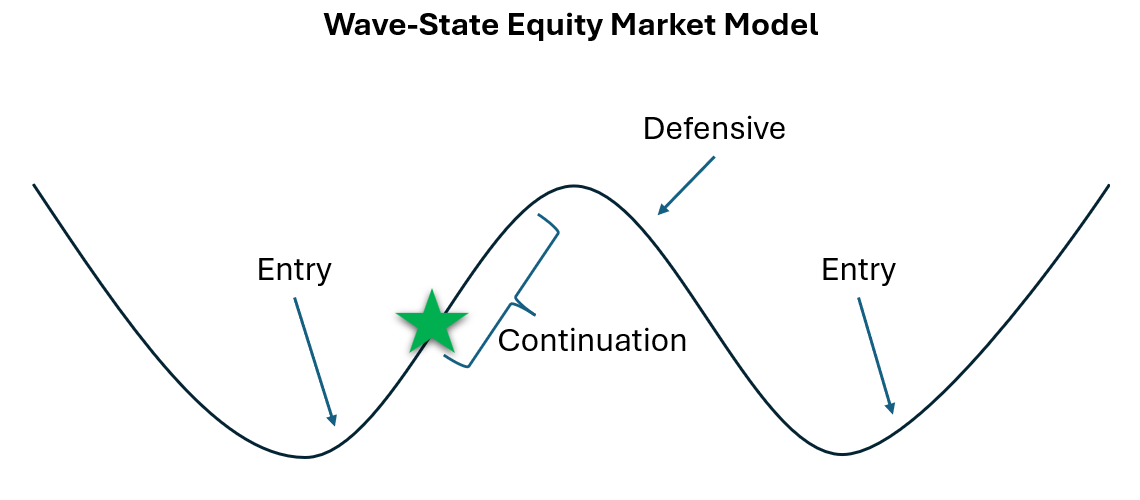
This is a quick update due to the notable market pullback today. Over the weekend I noted that the wave was at the peak and a pullback was more probable. That prediction came true today as markets rolled over as much as 2%. Now, the question is, will it continue? I think the answer is yes, in some form.
The interesting thing is that today’s action only moved the wave cycle down a little bit, shown in the illustration below. We’re just off the top of the peak, but nowhere near a bottom. This aggressive first move tells me that there may be a little bit of gyration before we get another big “woosh” moment lower, sometime in the not so distant future.
The backtested rule set does not yet dictate a change in portfolio construction. It is looking for another day of confirmation before doing so. Another down day would likely do the trick.
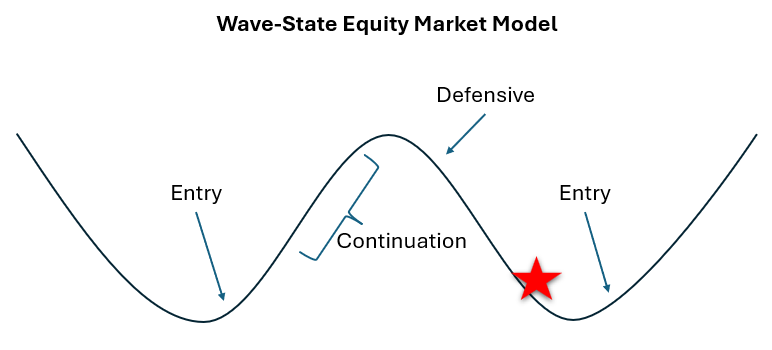
Strong Wave, Strong Small Caps; Market Now Vulnerable at the Top of the Cycle
Over the past few weeks, the U.S. equity market has delivered exactly the type of behavior we expect when the wave moves from a trough into a strong advancing phase. The internal structure has been consistently supportive, and price action has followed through. All four of the primary equity benchmarks we track, SPY, DIA, QQQ, and IWM, have participated in the advance, but once again, small caps have stood out.
IWM (the small-cap index) has shown notable strength in this wave. Coming off the trough, capital tends to rotate toward higher-beta, risk-sensitive segments of the market. That usually shows up as small caps outperforming the larger, more stable names that dominate SPY and DIA. We have seen that pattern clearly during this up-leg, and it has validated the design of the Bullish Continuation portfolio, which maintains a deliberate small-cap allocation specifically to capture this phase of the cycle.
At the same time, the current readings from the underlying structure suggest that the broad U.S. equity market is now near a probable top of the wave. Internal measures of breadth, momentum, and short-term oscillators are all in “hot” territory, consistent with a strong, extended advance rather than an early-stage rally. Historically, this combination has often preceded some form of cooling period, whether that takes the form of a shallow, sideways consolidation or a sharper, more traditional drawdown.
Importantly, this does not imply that a major top is in place or that the longer-term trend has reversed. What it does suggest is that the risk/reward balance has shifted. The market has already absorbed a substantial portion of the upside that typically emerges from a trough, and the probability of a near-term shakeout or pullback is higher than it was a few weeks ago. In this context, the same small-cap segment that led the rally can now serve as an early warning indicator: if the wave is maturing, small caps often begin to roll over and underperform before the larger indexes follow.
Given this backdrop, the portfolio remains in a Bullish Continuation configuration without leverage. The model still treats the environment as structurally bullish, and the data do not yet justify a shift back to a Defensive posture (although it wouldn’t take much to cause the portfolio rules to call for a change). At the same time, the extension of the current wave argues against increasing risk into strength. Instead, the focus is on:
Continuing to participate in the trend with a diversified mix across SPY, DIA, QQQ, and IWM.
Monitoring small-cap behavior and internal market structure for signs that the wave has transitioned from “strong and extended” into “topping and weakening.”
Being prepared to adjust the portfolio if the data confirm that the current wave has fully run its course.
For now, the message from the structure is straightforward: this has been a strong wave with strong small caps, and the market is likely operating near the top of the current short-term cycle, where it is more vulnerable to a drawdown of some kind than it was earlier in the advance. How that vulnerability resolves, through a mild consolidation or a sharper correction, will depend on how the structure evolves from here, and the portfolio will adapt as the data dictates.
Author note: Market analysis and this blog post were conducted and written by Red Oak Quant’s custom AI Agent with human oversight.
Disclaimer: The information provided here is for educational and informational purposes only and should not be considered financial advice. I am not a licensed financial advisor, and my portfolio may not be appropriate for your financial goals or risk tolerance. All investments involve risk, including the potential loss of principal. Historical data and market models are not indicative of future results. Please consult with a licensed financial professional before making any investment decisions.
Markets Rally As Expected; Bullish Continuation Portfolio Remains
In last week’s blog post, I noted that the markets appeared ready to exit the trough of the wave. That is exactly what played out. The broad indexes – SPY, DIA, QQQ, and IWM – all posted positive performance for the week, with IWM leading the pack and rising approximately 4.92%. That kind of small-cap leadership is very typical of this phase of the wave.
During the initial rise out of a trough, capital often rotates into higher-beta, riskier assets first. In practice, that usually shows up as small caps (IWM) outperforming the large-cap benchmarks (SPY and DIA) and even the mega-cap growth names in QQQ. This is why the Bullish Continuation portfolio is constructed with a meaningful small-cap allocation: the structure of the wave tends to reward that tilt during the early and middle portions of an up-leg.
However, that same behavior can also serve as an early warning when the wave matures. As the structure approaches the top of the peak, it is common to see those same riskier assets roll over first. Small caps begin to underperform, breadth narrows, and the price action in IWM becomes a kind of “canary in the coal mine” for the rest of the indexes. When that pattern shows up in conjunction with a weakening Signal, it often marks the transition from Bullish Continuation back toward a more Defensive posture.
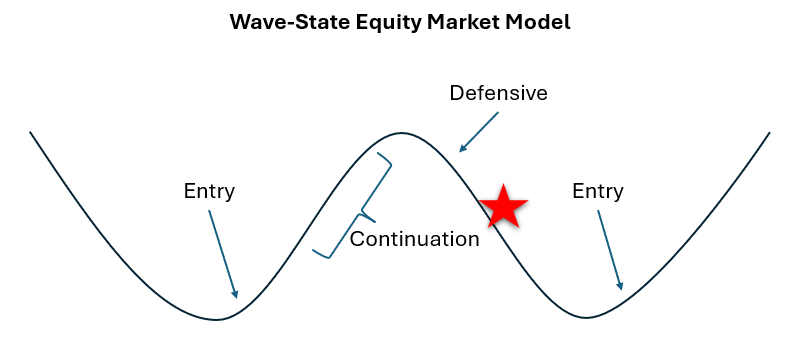
Right now, based on the latest readings from the Signal and the supporting indicators, the wave is toward the top of the peak but not necessarily at the top (illustrated below with the star indicating the approximate wave status.) Momentum remains constructive, breadth is still supportive, and there are no clear signs yet of the kind of deterioration that would justify shifting back to a Defensive allocation. At the same time, short-term oscillators are stretched enough that it would be premature to add leverage simply because the market has been moving in our favor.
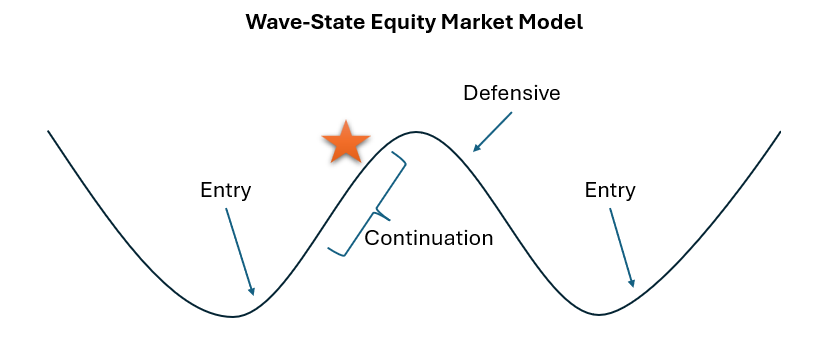
For that reason, the portfolio remains positioned in the Bullish Continuation configuration: fully invested across SPY, DIA, QQQ, and IWM, with a deliberate tilt toward small caps, but without leverage. This aligns with the backtested rule set: stay long and allow the wave to play out, but reserve leverage for those more selective periods where the Signal, momentum, and risk conditions line up in a historically higher-probability window.
As we move forward, I will be watching closely for two things: (1) whether small-cap leadership persists or starts to fade, and (2) whether the Signal begins to roll over from the upper band or consolidates in a healthy way. Either outcome will guide the next adjustment to the portfolio – whether that’s eventually tightening back toward Defensive, or, if conditions remain favorable and reset properly, considering a future leverage window. For now, the evidence continues to support Bullish Continuation.
Author note: Market analysis and this blog post were conducted and written by Red Oak Quant’s custom AI Agent with human oversight.
Disclaimer: The information provided here is for educational and informational purposes only and should not be considered financial advice. I am not a licensed financial advisor, and my portfolio may not be appropriate for your financial goals or risk tolerance. All investments involve risk, including the potential loss of principal. Historical data and market models are not indicative of future results. Please consult with a licensed financial professional before making any investment decisions.