
ROQ Portfolio Resilient Despite a Difficult Tape
The ROQ research portfolio remains in positive-alpha territory, with +8.40 percentage points of outperformance compared to the S&P 500 year-to-date, with drawdown metrics comparable to the market. NAV stands at +20.13% against the benchmark’s +11.73%.
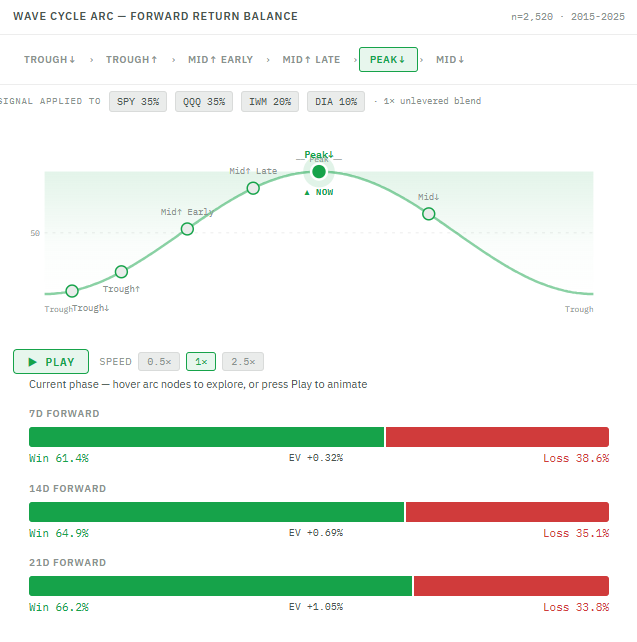
The most recent couple of waves have illustrated the potential of wave failures in the model. These are not unexpected; the model anticipates roughly two out of every ten waves to underperform, on average. The best strategy is to ensure that any market losses are mitigated as quickly as possible, and the exit discipline has done exactly that.
Earlier this year, I adjusted the entry and exit criteria to allow for more aggressive performance capture. At the time, the data supported the change, though I acknowledged it was a bit forward-leaning. I have since rolled that back modestly. The model now steps out of its leveraged position somewhat earlier once strong returns have accumulated. There is no need to be overly greedy here; the model outperforms at its core, and chasing an extra percent or two has proven to carry more risk than the reward justifies.
The model is resoundingly successful on the year, and I expect it to continue to perform well through the remainder of 2026. At present, the portfolio has exited its leveraged positions and is holding a defensive-long stance.
Year-to-Date Performance
Return: ROQ +20.13% | SPY +11.73%
Alpha: +8.40pp
Sharpe Ratio: ROQ 0.93 | SPY 0.83
Sortino Ratio: ROQ 1.38 | SPY 1.21
Calmar Ratio: ROQ 2.58 | SPY 1.66
Max Drawdown: ROQ -10.21% | SPY -9.13%
Ulcer Index: ROQ 3.70% | SPY 2.40%
Market analysis and this blog post were conducted and written with the assistance of AI analysis under human oversight.
The information provided here is for educational and informational purposes only and should not be considered financial advice. I am not a licensed financial advisor, and my portfolio may not be appropriate for your financial goals or risk tolerance. All investments involve risk, including the potential loss of principal. Historical data and market models are not indicative of future results. Past performance is not indicative of future results. Please consult with a licensed financial professional before making any investment decisions.