Navigating Geopolitical Volatility: Framework Delivers Through Market Extremes
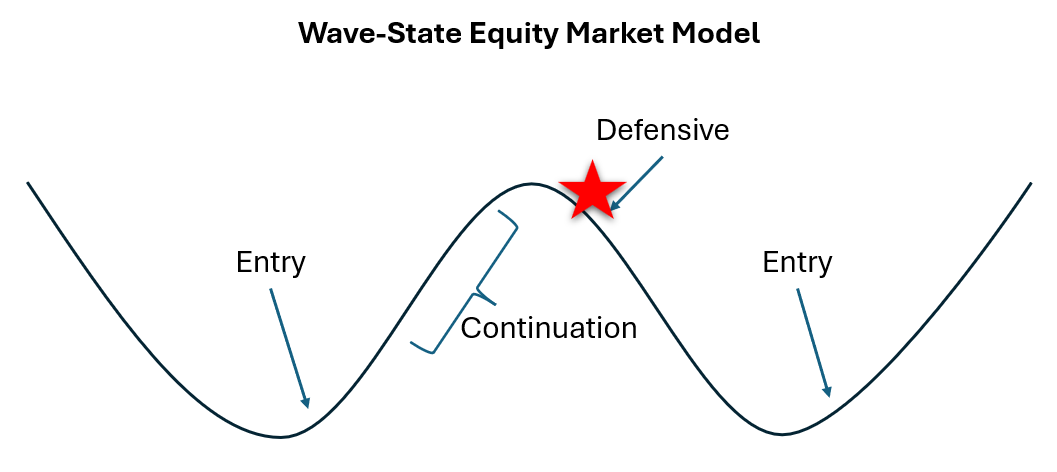
The past two months have tested every dimension of the Wave-State framework. From late February through early April, markets grappled with escalating Middle East tensions that drove extreme volatility, a near 10% drawdown followed by a sharp 5% recovery in less than four weeks. The framework navigated this turbulent period without trying to predict headlines or trade geopolitical developments, relying instead on market structure to manage risk and capture opportunity.
The portfolio entered defensive positioning in late February as internal breadth and momentum deteriorated, well before geopolitical fears peaked. Markets bottomed on March 20 at SPY $648.57, having declined nearly 10% from recent highs. The wave structure spent three weeks building a proper trough in deeply oversold territory before reversing sharply higher. From the March 17 trough through April 10, the portfolio delivered +1.61% versus SPY's +1.29%, capturing the recovery while managing through five state transitions as volatility remained elevated. The defensive period from February 24 through March 17 underperformed by -0.62% as growth and small-cap segments within the defensive allocation were hit harder than large caps, but the positioning successfully limited exposure during the peak of the selloff.
The recovery phase proved challenging from an execution standpoint. The wave structure reversed violently—momentum surged 38 points and oscillator readings swung from single digits to extreme overbought levels in just three weeks. This created whipsaw conditions where the framework shifted between defensive and aggressive postures multiple times as signals triggered, cooled down, and reversed. The framework doesn't trade headlines or attempt to anticipate geopolitical resolution. It responds to what markets are doing, not what might happen next. In this case, the signals provided structure during a period when headline-driven volatility would have been nearly impossible to navigate through discretion alone.
Since inception in early December, the Wave-State Model has delivered -0.24% versus SPY's -0.65%, maintaining a +0.41% edge through multiple market cycles and significant geopolitical disruption. The framework's strength isn't perfection during every market phase; it's consistent risk management that preserves capital during drawdowns and captures recoveries when the structure confirms. The past two months demonstrated both: defensive positioning during the worst of the decline, followed by participation in the recovery despite choppy execution.
Performance Summary:
Since Inception (Dec 3 - Apr 10): ROQ -0.24% vs SPY -0.65% (+0.41% outperformance)
Trough Period (Feb 24 - Mar 17): ROQ -3.03% vs SPY -2.41% (-0.62% underperformance during selloff)
Recovery Period (Mar 17 - Apr 10): ROQ +1.61% vs SPY +1.29% (+0.32% outperformance)
Author note: Market analysis and this blog post were conducted and written with the assistance of AI analysis under human oversight.
Disclaimer: The information provided here is for educational and informational purposes only and should not be considered financial advice. I am not a licensed financial advisor, and my portfolio may not be appropriate for your financial goals or risk tolerance. All investments involve risk, including the potential loss of principal. Historical data and market models are not indicative of future results. Please consult with a licensed financial professional before making any investment decisions.