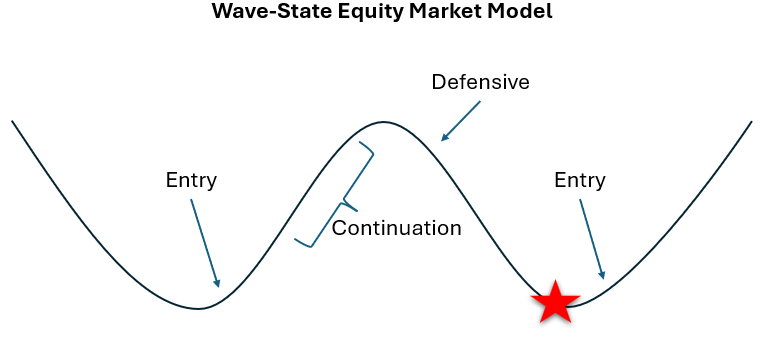
ROQ Indicators Show That a Trough Is Forming
The current wave peaked around August 15th, and since then the signal has been in a slow and steady decline down the backside of the wave. The algorithm was a little late to exit from the leveraged position, leading to some give-back on performance. This is something that could be avoided with a little human input. The wave had outperformed mightily, and it would have made sense to transition to an unleveraged position given the run we'd had.
Entering the wave on July 28, the research portfolio was already ahead of the S&P 500 by over 8 percentage points year to date, the result of disciplined defensive positioning and earlier bullish episodes. The wave itself added approximately 2.5 additional percentage points of outperformance, bringing the year-to-date lead to nearly 11 points at the wave's peak. That lead has settled back to just under 11 points following the corrective period since.
Year-to-date performance through August 28:
ROQ Research Portfolio: +22.3%
S&P 500: +12.4%
Alpha vs. S&P 500: +9.9 percentage points
Maximum Drawdown: -9.5% (vs. S&P 500's -9.1%)
Risk-adjusted metrics vs. S&P 500:
Sharpe Ratio: 1.44 vs. 1.08
Sortino Ratio: 2.45 vs. 1.67
Calmar Ratio: 4.10 vs. 2.15
Now, the wave is showing signs of trough formation. The internal indicators have been in oversold territory for several sessions. This is the pattern that historically precedes quality bullish signals in this model. It is reasonable to expect that the signal will give us a bullish turn in the next few trading sessions. The question will be whether we have another leveraged entry opportunity, or simply a return to the unleveraged growth allocation. We'll see in the coming days.
Market analysis and this blog post were conducted and written with the assistance of AI analysis under human oversight.
The information provided here is for educational and informational purposes only and should not be considered financial advice. I am not a licensed financial advisor, and my portfolio may not be appropriate for your financial goals or risk tolerance. All investments involve risk, including the potential loss of principal. Historical data and market models are not indicative of future results. Please consult with a licensed financial professional before making any investment decisions.